
From Portfolio Screening To One Plot That Needs Evidence
A company may have supplier plots, but still need a practical way to check deforestation exposure, protected areas, and indigenous lands. That work often turns into a GIS request, a spreadsheet handoff, or a one-off consultant task.
Vantage makes that step self-serve.
Peru Coffee Dataset
We uploaded 27 Peru coffee plots and ran the geospatial EUDR checks. Most plots came back low risk, which is what a normal supplier file should look like. The run also found one high-risk plot and two medium-risk plots, giving the team a small review queue instead of another static dataset.
The Peru run split was:
27 plots analyzed.
1 high EUDR risk plot.
2 medium EUDR risk plots.
24 low EUDR risk plots.
0 protected-area overlaps.
0 indigenous-land overlaps.
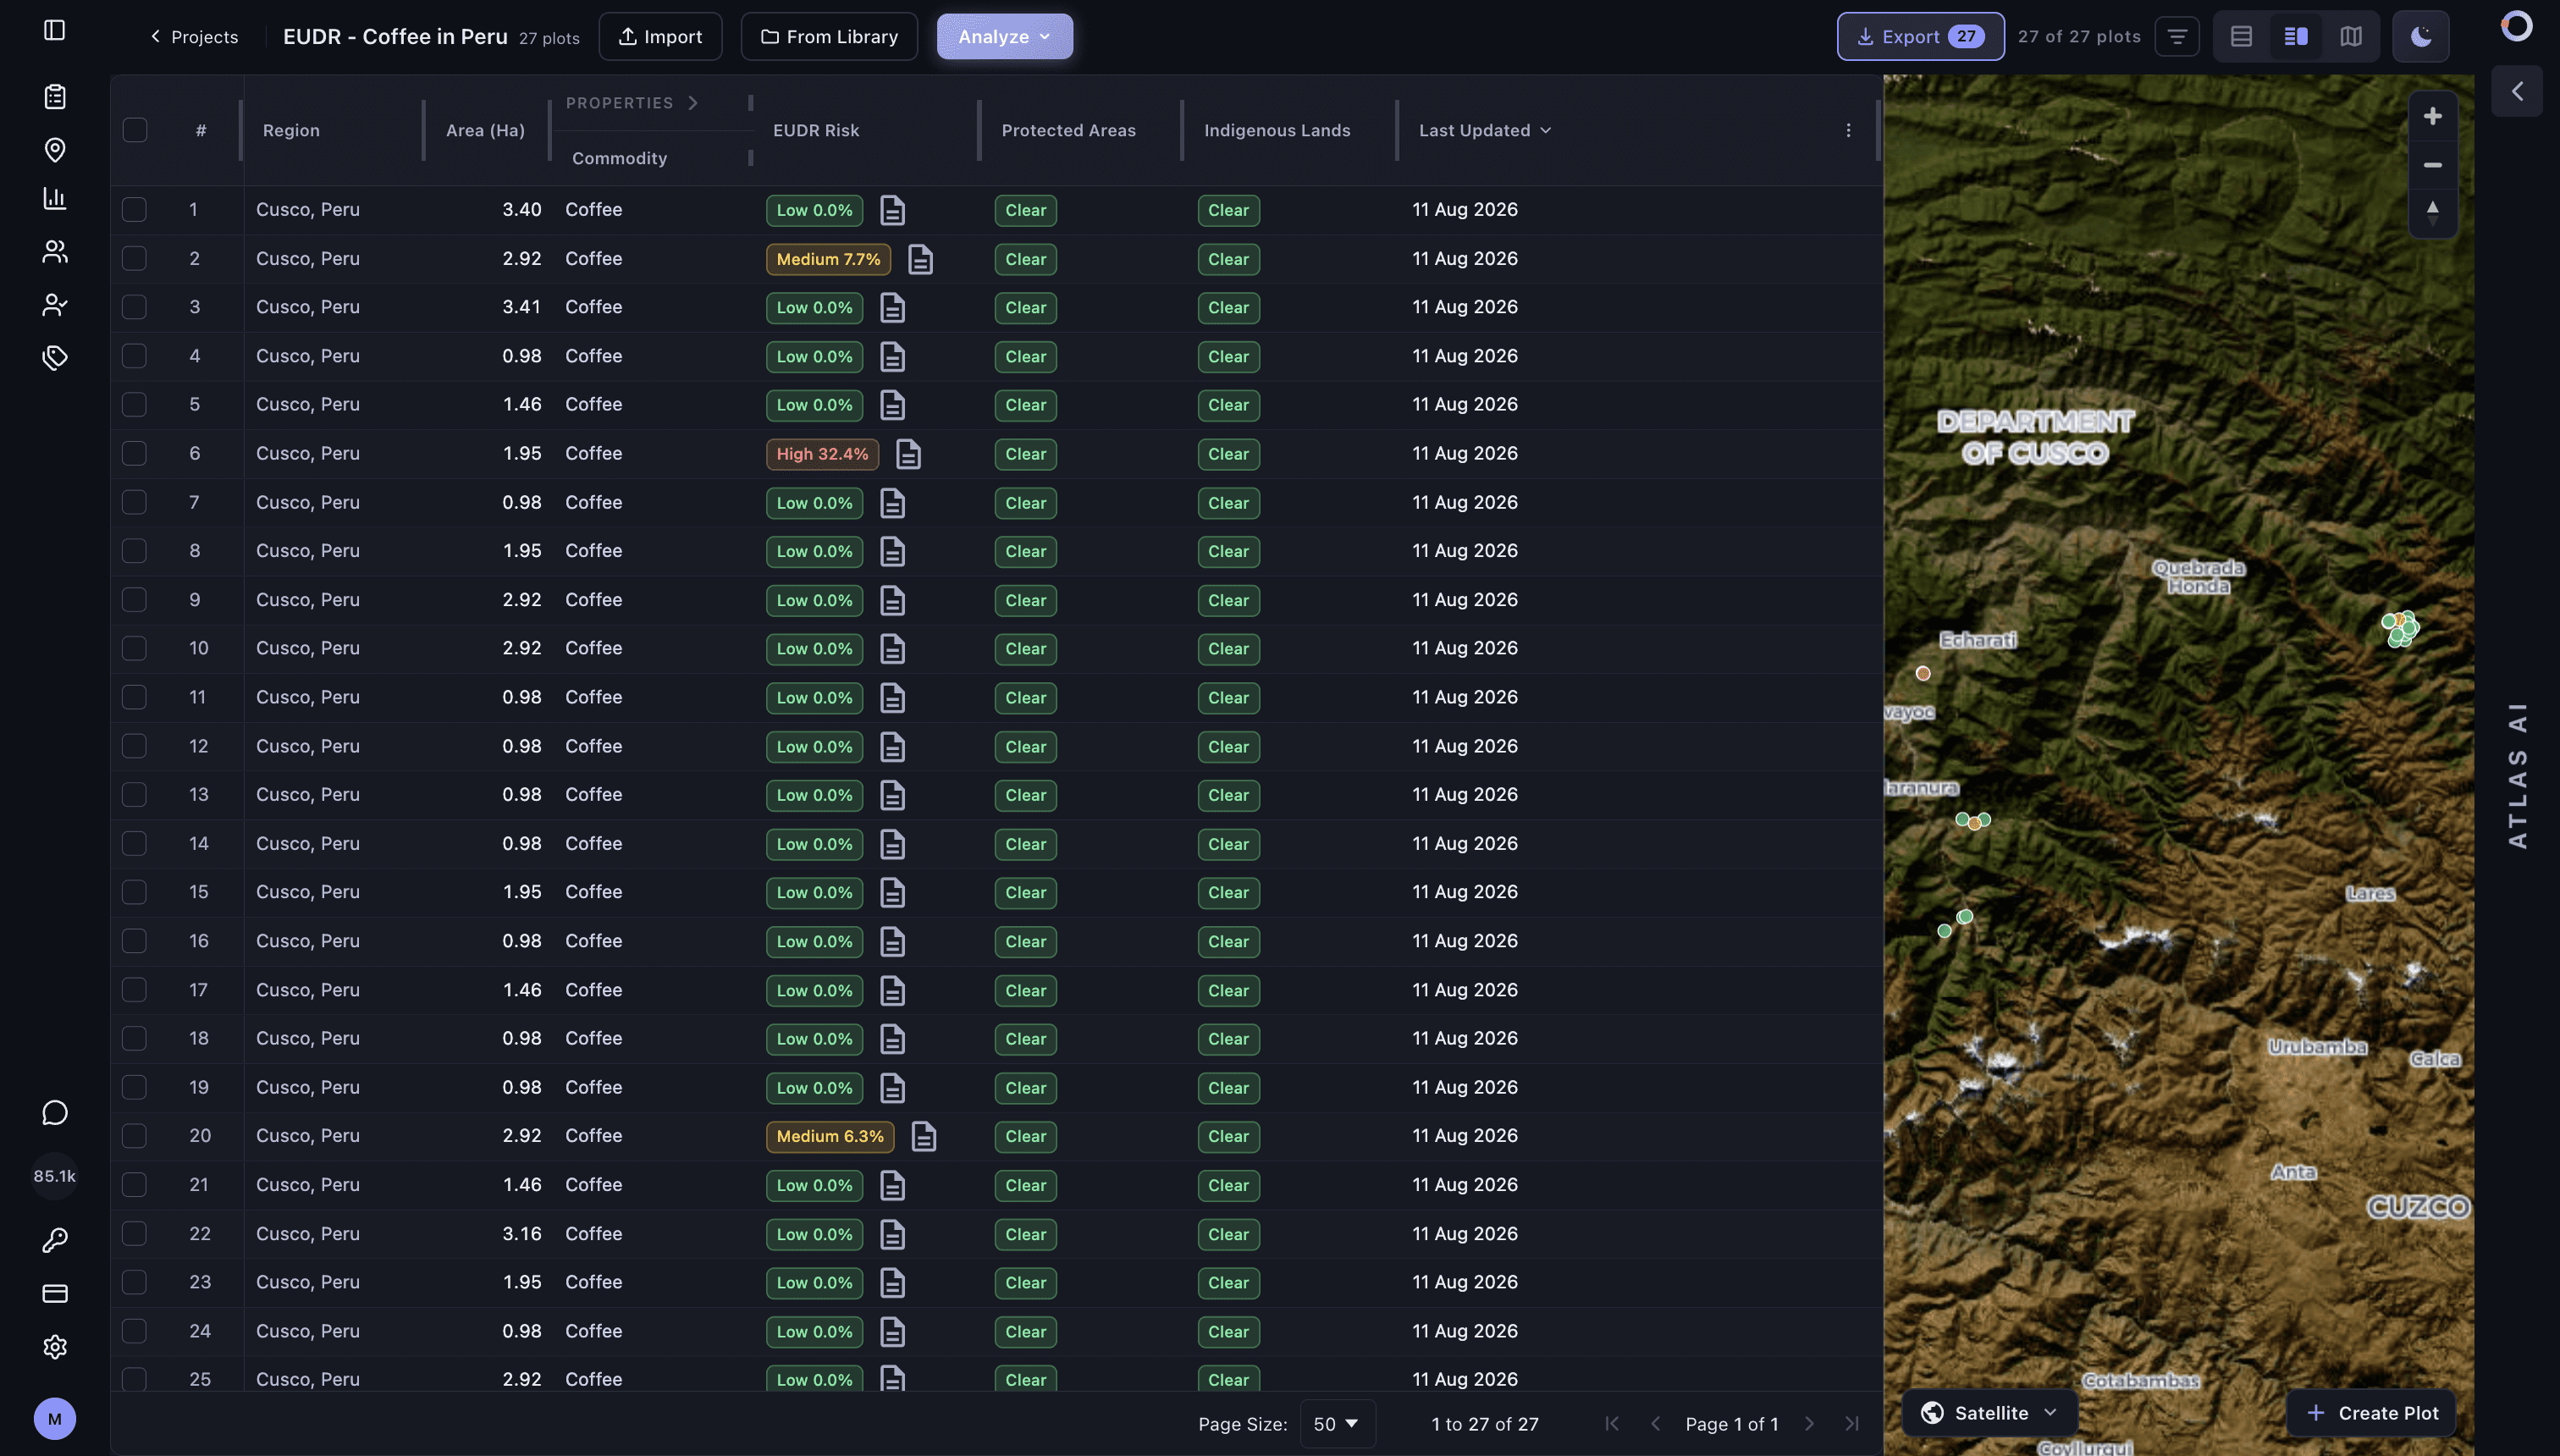
The high-risk example is a 1.95 hectare coffee plot in Cusco, Peru. Vantage flagged it as high risk because 32.4% of the plot, or 0.63 hectares, was detected as deforestation.
Evidence
The report below shows the plot-level assessment, temporal imagery and regional context behind the high-risk result.

The report does not stop at a label. It shows:
The plot summary: ID, location, area, commodity, risk level, harvest date, and assessment date.
Temporal satellite imagery for 2020, 2023, and 2026.
Land-use / land-cover evidence showing the detected deforestation.
A regional map view.
Protected-area and indigenous-land checks, both clear in this example.
Methodology notes for the underlying assessment.
A user can start with a small supplier file, find the plots that need attention, open the report, and decide what evidence to submit or what supplier follow-up is needed.
Small teams can run this directly in Vantage. Larger teams can call the same checks through the API and attach the resulting report to their supplier, sourcing, or compliance system.
Review EUDR evidence with Vantage.
Screen supplier locations, inspect risk drivers and identify records that need follow-up.
Explore EUDR →